Health analysis in the Shturval platform
The platform includes the following components for continuous health analysis of components and applications:
- a local log collection module;
- a log storage component;
- a local metrics collection module;
- an external metrics visualization module.
Monitoring
The platform includes VM Agent for metrics collection. It is part of the recommended system services installed with a client cluster. By default, VM Agent collects metrics from system components and forwards them to the Victoria Metrics cluster in the management cluster.
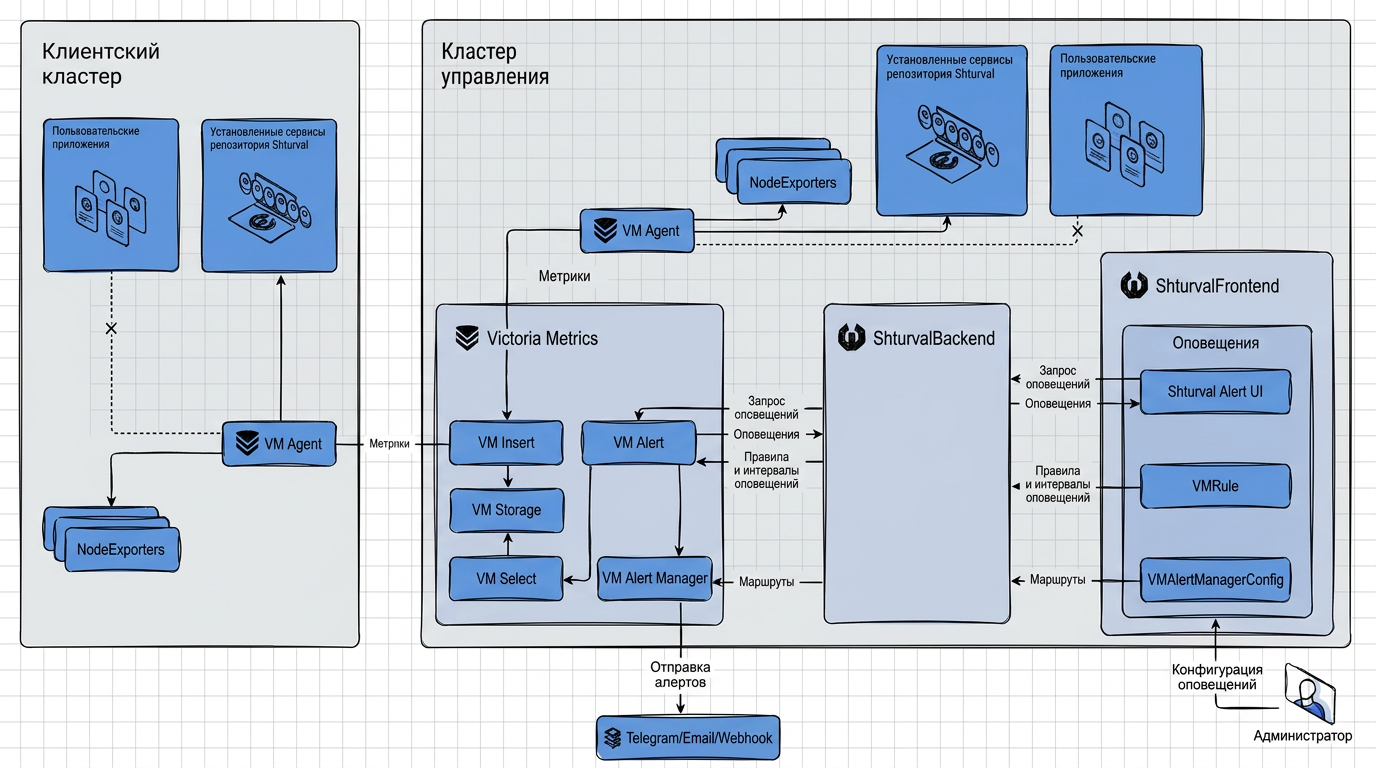
Collected metrics are available on preconfigured Grafana dashboards. You can further configure installed services, redirect metrics from VM Agent, set up application monitoring, or replace services with corporate alternatives.
Alerting
Alerts are generated in the Victoria Metrics cluster based on collected metrics. An alert report is available in the client cluster interface.
The platform includes VM Alert Manager for configuring alerting and aggregation rules.
You can also configure alert delivery through multiple channels:
Logging
Vector is used to collect logs in client clusters and the management cluster. The platform records logs for:
- authentication;
- backend;
- audit;
- all system components;
- user workload applications.
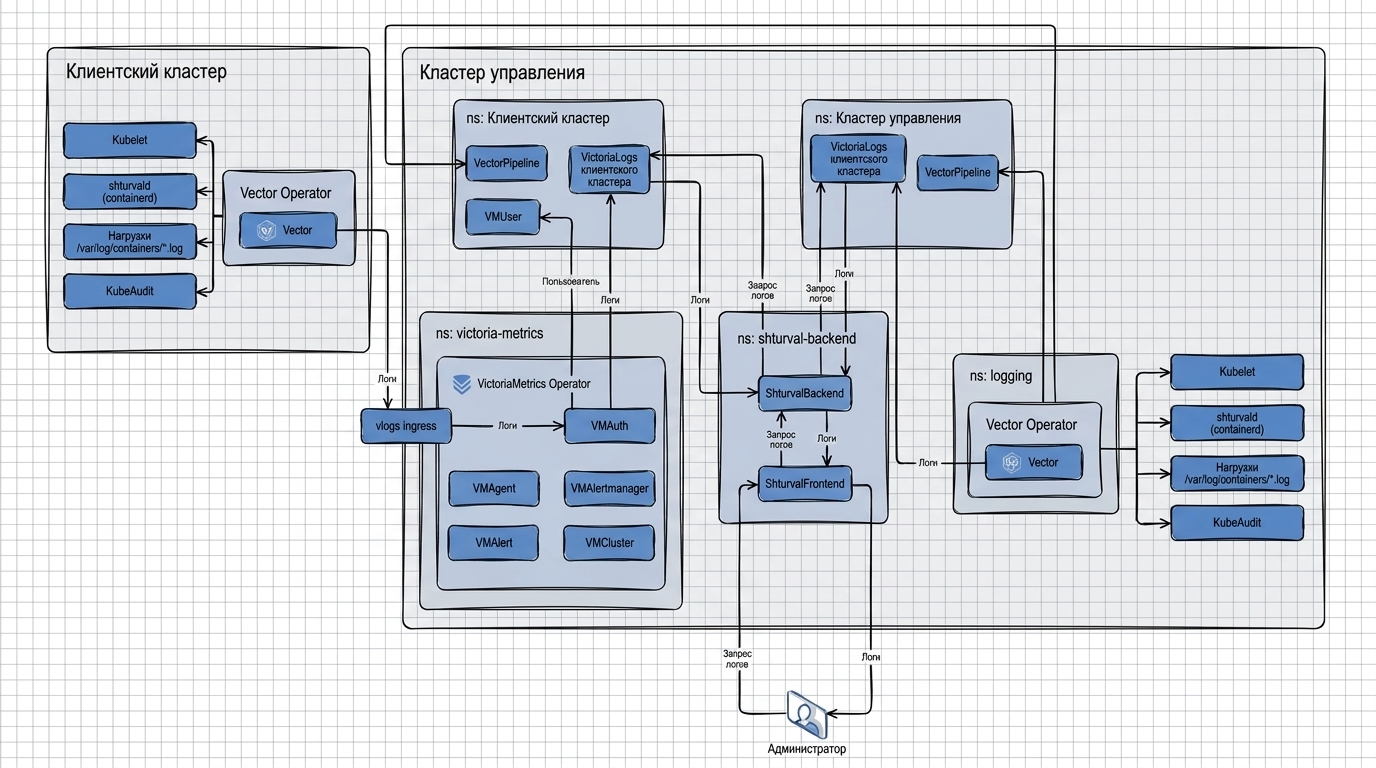
Collected logs are routed to the management cluster and stored in VLogs. Cluster logs are available in the GUI on the Logs tab of the cluster dashboard when:
- The local log collection module Vector (
shturval-log-collector) is enabled in the cluster. - The monitoring module management component Victoria Metrics Agent (
shturval-metrics-collector) is running in the management cluster.